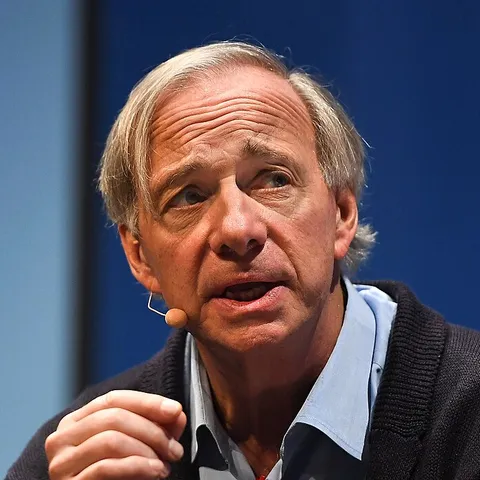
Ray Dalio
Bridgewater Associates
Founder of the world's largest hedge fund, a macro investor spread across hundreds of stocks.
- Period
- Q2 2026 As of Jun 30, 2026
- Filed
- Aug 14, 2026
- Positions
- 997
- Source
- SEC Filing
Largest Positions
- SPYSPDR S&P 500 ETF Trust16.3%$3.97 BAdded+ 22%
- IVVISHARES TR9.2%$2.25 BAdded+ 12%
 NVDANVIDIA Corp3.2%$774 MTrimmed− 18%
 AVGOBroadcom Inc2.0%$498 MTrimmed− 28%
 AMZNAmazon.com Inc2.0%$483 MTrimmed− 54%
 GOOGLAlphabet Inc.1.9%$473 MTrimmed− 34%
 LRCXLam Research Corp1.7%$407 MTrimmed− 40%
- VOOVANGUARD INDEX FDS1.3%$315 MAdded+ 189%
Remaining 989 Positions 62.4%
What They Did This Quarter
New214





Added399





Trimmed377
Sold Out210
 CSCOCisco Systems Inc$63.8 M
- ASXASE TECHNOLOGY HLDG CO LTD$33.6 M
 CRWVCoreWeave, Inc.$28.2 M
- PRIMPRIMORIS SVCS CORP$19.5 M
 BNBrookfield Corp$19.3 M
- +205 More
All Positions · 997
| Rank | Company | Shares | Value | Weight | Change |
|---|---|---|---|---|---|
| 1 | SPYSPDR S&P 500 ETF Trust | 5.32 M | $3.97 B | 16.3% | Added+ 22% |
| 2 | IVVISHARES TR | 3.00 M | $2.25 B | 9.2% | Added+ 12% |
| 3 | NVDANVIDIA Corp | 3.87 M | $774 M | 3.2% | Trimmed− 18% |
| 4 | AVGOBroadcom Inc | 1.32 M | $498 M | 2.0% | Trimmed− 28% |
| 5 | AMZNAmazon.com Inc | 2.03 M | $483 M | 2.0% | Trimmed− 54% |
| 6 | GOOGLAlphabet Inc. | 1.32 M | $473 M | 1.9% | Trimmed− 34% |
| 7 | LRCXLam Research Corp | 938,224 | $407 M | 1.7% | Trimmed− 40% |
| 8 | VOOVANGUARD INDEX FDS | 458,381 | $315 M | 1.3% | Added+ 189% |
| 9 |  AMDAdvanced Micro Devices Inc | 538,632 | $313 M | 1.3% | Trimmed− 58% |
| 10 | EWYISHARES INC | 1.38 M | $280 M | 1.1% | Trimmed− 22% |
| 11 |  MSFTMicrosoft Corporation | 711,896 | $266 M | 1.1% | Trimmed− 34% |
| 12 |  NEMNewmont Corporation | 2.70 M | $252 M | 1.0% | Added+ 16% |
| 13 |  AMATApplied Materials Inc | 291,426 | $211 M | 0.86% | Trimmed− 48% |
| 14 |  ORCLOracle Corporation | 1.43 M | $210 M | 0.86% | Trimmed− 10% |
| 15 |  STXSeagate Technology Holdings PLC | 199,822 | $193 M | 0.79% | Trimmed− 39% |
| 16 |  JNJJohnson & Johnson | 669,135 | $170 M | 0.70% | Trimmed− 4% |
| 17 | VWOVANGUARD INTL EQUITY INDEX F | 2.75 M | $164 M | 0.67% | Added+ 1% |
| 18 |  GEVGE Vernova Inc | 122,768 | $144 M | 0.59% | Trimmed− 72% |
| 19 |  UNPUnion Pacific Corporation | 514,266 | $140 M | 0.57% | Trimmed− 3% |
| 20 |  MUMicron Technology Inc | 116,666 | $135 M | 0.55% | Trimmed− 92% |
| 21 | MBBISHARES TR | 1.39 M | $131 M | 0.54% | Added+ 2% |
| 22 |  MOAltria Group Inc | 1.73 M | $124 M | 0.51% | Added+ 1% |
| 23 |  APHAmphenol Corp | 697,612 | $123 M | 0.50% | Trimmed− 19% |
| 24 |  ASMLASML Holding NV | 61,675 | $123 M | 0.50% | Trimmed− 33% |
| 25 | BBARRICK MNG CORP | 3.30 M | $121 M | 0.50% | Added+ 7% |
Recent Quarters
- $17.7 BQ3 2024773 Positions
- $21.8 BQ4 2024691 Positions
- $21.6 BQ1 2025664 Positions
- $24.8 BQ2 2025585 Positions
- $25.5 BQ3 20251014 Positions
- $27.4 BQ4 20251040 Positions
- $22.4 BQ1 2026993 Positions
- $24.4 BQ2 2026997 Positions
Each bar is the stock portfolio at that quarter's end; options not included.
Not Investment Advice
This screen shows public filings. Copying these investors' trades is not a recommendation; the data is weeks or even months late and does not show the whole position.
A 13F only shows long positions and options traded in the US; short sales, cash and foreign shares are not visible. The filing can come up to 45 days after quarter end.
Buys and sells are computed from the SHARE COUNT difference between two consecutive filings; price changes are not counted as buying. Stock splits are removed from the counts.
Positions without a known ticker (bonds, foreign shares, delisted companies) are shown by their name in the filing.
Photo: Web Summit · CC BY 2.0 · Cropped
SEC EDGARFiled Aug 14, 2026 · As of Jun 30, 2026
To Understand This